Path Between Homes

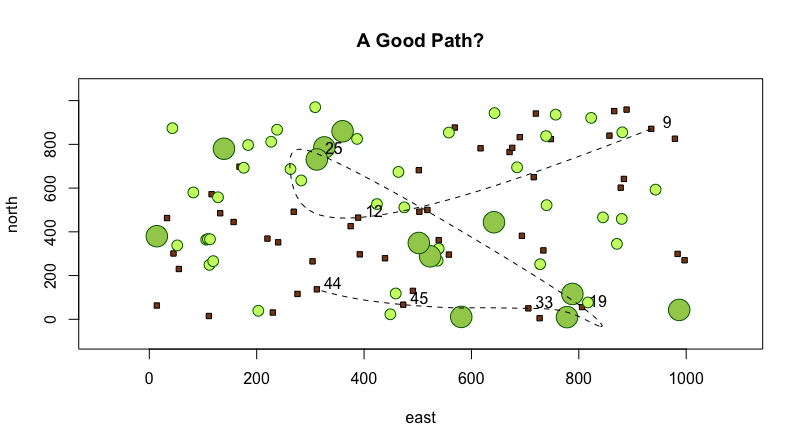
This plot shows 50 houses represented by the beige squares, 40 small trees represented by small green circles, and 12 large trees represented by large green circles. The spline shows a person's potential route between 7 randomly chosen houses. See code below.
x <- 1:1000
y <- 1:1000

east <- sample(x, size = 50, replace = TRUE)
north <- sample(y, size = 50, replace = TRUE)
houses <- cbind.data.frame(id = 1:50, east, north)
symbols(east, north, squares = rep(10,50), inches = FALSE, bg="saddlebrown")

east <- sample(x, size = 40, replace = TRUE)
north <- sample(y, size = 40, replace = TRUE)
small_trees <- cbind.data.frame(id = 1:40, east, north)
symbols(east, north, circles = rep(10,40), inches = FALSE, fg = "darkgreen", bg = "darkolivegreen1", add = TRUE)

east <- sample(x, size = 12, replace = TRUE)
north <- sample(y, size = 12, replace = TRUE)
big_trees <- cbind.data.frame(id = 1:12, east, north)
symbols(east, north, circles = rep(20,12), inches = FALSE, fg = "darkgreen", bg = "darkolivegreen3", add = TRUE)

locs <- sample(50, size = 7)
xspline(x = houses[locs, 2], y = houses[locs, 3], shape = -1, lty = 2)
text(x = houses[locs, ]$east + 30, y = houses[locs, ]$north + 30, labels = houses[locs, ]$id)

title(main="A Good Path?")